Credit Card Cash Back Calculator
Estimate your annual cash back earnings and compare cards to maximize your rewards.
Your data is safe. All calculations are done on your device.
Quick Presets
Your Spending
Credit Cards
Your Cash Back Results
Your Results
Year 1 Cash Back
$0.00
Subsequent Years
$0.00
Effective Cash Back Rate
0.00%
Breakdown
Detailed Results
| Category | Spending | Cash Back |
|---|---|---|
| Total | $0.00 | $0.00 |
How to Use This Calculator
- Enter your spending in each category, using the toggle for monthly or annual amounts.
- For each card you wish to evaluate, set the cash back rates, annual fee, and sign-up bonus.
- Use the 'Compare' checkbox to include a card in the calculation.
- Your results on the right will update automatically, showing the best performing card.
- Use the 'Download PDF' or 'Copy Link' buttons to save or share your calculation.
Disclaimer: This calculator is for informational purposes only. The results are estimates based on the information you provide and may not be accurate or applicable to your specific financial situation. The information provided does not constitute financial, legal or tax advice. We do not guarantee the accuracy of the calculations or the applicability of any information. Always consult a qualified financial professional for advice specific to your personal circumstances. Credit card terms, conditions, rates and offers are subject to change by the issuing bank at any time. We are not responsible for any actions or decisions taken based on the information provided by this tool.
Most people swipe their cards every day without knowing how much they’re really earning back. If you’ve ever wondered whether your rewards card is actually working for you, you’re not alone. Many cardholders leave over $100 a year on the table simply by not comparing their options. Using a credit card cash back calculator can change that in seconds.
The right tool shows you exactly how much cash back you’ll earn, based on your real spending habits.
In this guide, I’ll walk you through how cash back works, how this tool runs its numbers, and how to use every feature to maximize your rewards.
What Is Cash Back on a Credit Card?
Cash back is a type of credit card reward. It gives you a small percentage of your spending back as a dollar credit, a direct deposit, or a statement credit.
Think of it like a mini rebate on every transaction you make.
For example, if your card earns 2% cash back on all purchases and you spend $500 on groceries, you’d earn $10 back. That may sound small, but it adds up fast over a year.
According to The Motley Fool, the average American household earns around $500 a year in credit card rewards. That’s real money sitting in your pocket, just for spending the way you already do.
Cash back is simple. It’s predictable. And it features one of the most accessible reward structures for beginners. That’s probably why a Bank of America survey found that about 75% of cardholders ranked cash back as their top reward preference, above points and airline miles.
The 3 Main Types of Cash Back Rewards
Not all cash back cards work the same way. There are three main structures you’ll run into.
1. Flat-Rate Cash Back
This is the simplest type. You earn the same rate on every purchase, no matter what you buy.
A 2% flat-rate card gives you 2 cents back for every dollar spent. No categories to track. No caps to worry about.
This works well for people whose spending is spread across many different areas. NerdWallet notes that 1.5% is now considered the baseline standard, and many competitive flat-rate cards are pushing toward 2%.
2. Category-Based (Tiered) Cash Back
These cards offer higher rates in specific spending areas. For example:
- 5% on groceries
- 3% on dining
- 2% on gas
- 1% on everything else
This structure can pay off much better than flat-rate cards, but only if your spending aligns with those high-reward categories. That’s exactly where the rewards estimator on this page becomes useful.
3. Rotating Category Cash Back
Some cards rotate their top-earning categories every quarter. You might earn 5% on gas in January through March, then 5% on groceries from April through June.
The catch? You usually have to activate the bonus each quarter. And the high rate is often capped at a set annual spending limit.
How the Calculator Computes Your Rewards
Here’s what most people don’t know: the math behind cash back rewards is more layered than it looks. This tool uses a formula that reflects how cards actually work in the real world.
The Core Formula
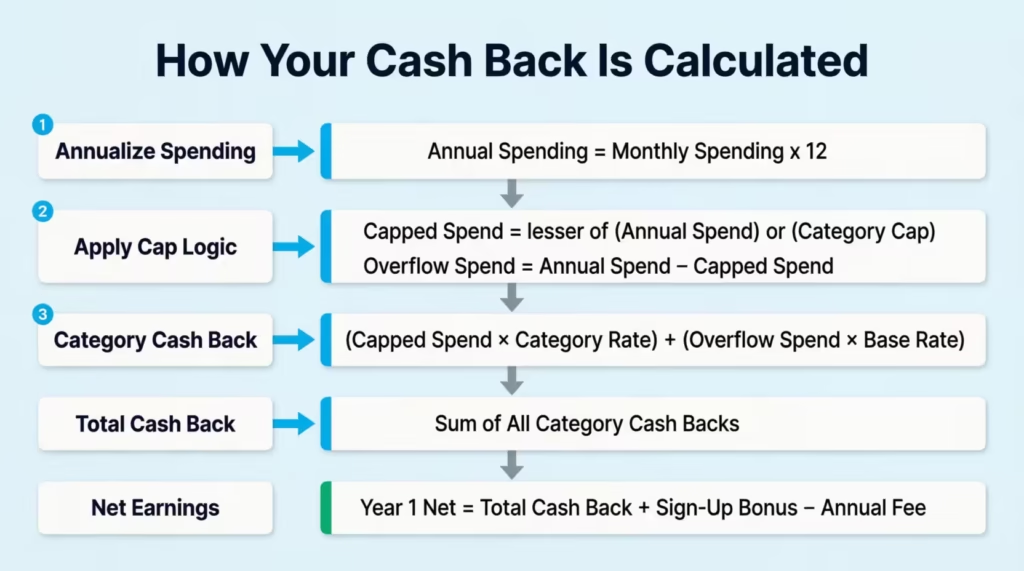
Step 1: Convert your spending to an annual figure.
If you enter monthly amounts, the tool multiplies by 12 to get your yearly spending per category.
Annual Spending = Monthly Spending x 12
Step 2: Apply the category rate, with cap logic.
Some cards have a yearly cap on how much you can earn in a bonus category. Once you hit that cap, your spending in that category earns the lower base rate instead.
The formula manages this with precision.
Capped Spend = the lesser of (your annual spend) or (the category cap)
Overflow Spend = any spending above the cap
Category Cash Back = (Capped Spend x Category Rate) + (Overflow Spend x Base Rate)
Step 3: Add up all categories.
Total Cash Back = Sum of all category cash backs
Step 4: Calculate your net earnings.
This is where the annual fee and sign-up bonus come in.
Year 1 Net = Total Cash Back + Sign-Up Bonus – Annual Fee
Subsequent Years’ Net = Total Cash Back – Annual Fee
Step 5: Find your effective rate.
This number tells you the real return you’re getting on your total spending, after fees are removed.
Effective Cash Back Rate = (Total Cash Back – Annual Fee) / Total Annual Spend x 100
This effective rate is one of the most powerful numbers in this tool. It lets you compare any two cards on equal footing, even if they have very different fee and reward structures.
Step-by-Step: How to Use This Credit Card Cash Back Calculator
This tool is built to be fast and flexible. Here’s how to get the most out of it.
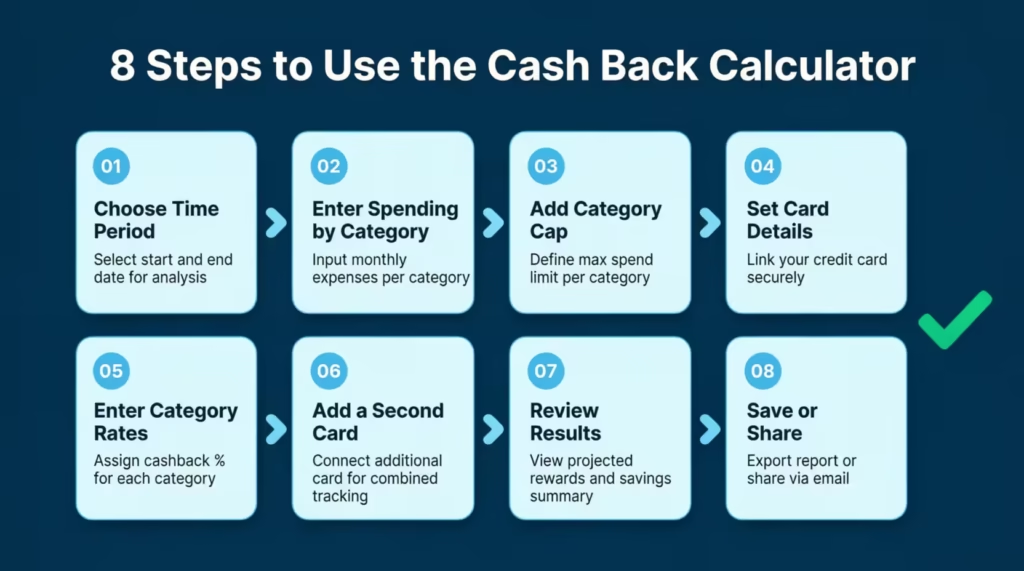
Step 1: Choose Monthly or Annual Spending
At the top of the spending section, you’ll see a toggle. Flip it to match how you think about your budget.
Most people find it easier to enter their monthly amounts since that’s how most bills work. The tool will handle the annual conversion without manual input.
Step 2: Enter Your Spending by Category
You’ll see five default categories:
- Groceries
- Dining
- Gas
- Travel
- Other
Type in how much you spend in each one. Don’t overthink it. A ballpark figure works fine.
Need a starting point? Use the Quick Preset buttons at the top:
- Average Household: $500/mo groceries, $200 dining, $150 gas, $250 travel, $100 other
- Frequent Traveler: $300 groceries, $400 dining, $200 gas, $800 travel, $150 other
- Minimal Spender: $250 groceries, $50 dining, $50 gas, $0 travel, $50 other
These presets use realistic spending profiles to give you a solid starting estimate.
Step 3: Add a Spending Cap (Optional)
If your card limits how much you can earn at the bonus rate in a category, enter that cap in the “Category Cap” field. For example, some cards cap grocery rewards at $6,000 per year.
If your card has no cap, leave this field empty. The calculator defaults to no limit.
Step 4: Set Up Your Card Details
Under the “Credit Cards” section, fill in your card’s information:
- Card Name: Give it a name you’ll recognize, like “My Chase Card.”
- Annual Fee: Enter the yearly fee in dollars. If it’s $0, just type 0.
- Sign-Up Bonus: Enter the dollar value of any welcome offer.
- Base Cash Back Rate: This is the default rate earned on purchases outside bonus categories.
Step 5: Enter Category-Specific Rates
Click on “Category Specific Rates” to expand that section. Enter the rate your card earns in each category.
For example, if your card earns 3% on groceries, type 3 in the groceries field.
Step 6: Add a Second Card to Compare
Want to see which card wins for your spending? Check the “Compare” box on both cards. The calculation tool will calculate both results and highlight the winner without manual input.
It also shows you exactly how much more you’d earn with the better card during Year 1.
Step 7: Review Your Results
On the right side of the calculator, you’ll see:
- Year 1 Cash Back: Your net earnings including the sign-up bonus
- Subsequent Years Cash Back: Your net earnings without the one-time bonus
- Effective Cash Back Rate: Your real return after fees
- Category Breakdown Chart: A visual split showing where your earnings come from
- Detailed Table: A line-by-line look at spending and cash back per category
Step 8: Save or Share Your Results
Use the Download PDF button to save a snapshot of your results. Use the Copy Link button to share the exact inputs and results with someone else. You can share directly on Facebook, Twitter, WhatsApp, or Reddit.
Understanding Your Results
Let’s break down what each output actually means.
Year 1 Cash Back
This figure includes your sign-up bonus. It’s the number that often makes premium cards look very attractive in the first year.
Be careful here. A high Year 1 number doesn’t always mean a card is the best long-term choice.
Subsequent Years Cash Back
This is your true, ongoing annual value. It’s what you’ll earn every year once the welcome bonus is gone. This number is often the most important one for long-term decision-making.
Effective Cash Back Rate
This is the percentage of your total spending that comes back to you, after subtracting the annual fee.
For example, if you spend $15,000 a year and earn $320 after fees, your effective rate is about 2.13%.
A higher effective rate means a better return on your spending. Use this number to ensure a fair comparison of the cards.
The Insights Box
Below your results, a yellow insight box appears when comparing two cards. It tells you how much more you’d earn with the better card. This is a quick gut-check before you make a decision.
How to Compare Two Cards Side by Side
The multi-card comparison feature is one of the most useful parts of this rewards estimator. Here’s how to get the most out of it.
Step 1: Make sure both cards have the “Compare” box checked.
Step 2: Enter the actual rates from each card’s terms. Don’t guess. Pull up each card’s benefits page and copy the rates directly.
Step 3: Check the Year 1 numbers. If Card B wins Year 1 only because of a large sign-up bonus, check the “Subsequent Years” number to see the true long-term picture.
Step 4: Look at the Effective Cash Back Rate. This is the fairest comparison metric because it already accounts for the annual fee.
Real example: Marcus, a teacher in Phoenix, was carrying a no-fee card earning 1.5% flat on everything. He ran a comparison using his actual monthly spending of $520 on groceries, $180 on dining, and $90 on gas.
Switching to a category-based card with 3% groceries and 2% dining bumped his annual cash back from $178 to $312. That’s $134 more per year, just from running the numbers.
Is an Annual Fee Worth It? Here’s How to Know
This is one of the most common questions people have about rewards cards.
A card with a $95 annual fee can still offer good value. It’s only bad if you don’t earn enough rewards to offset it.
The Break-Even Rule
To justify a $95 annual fee at a 2% rewards rate, a cardholder needs to spend at least $4,750 per year on that card.
Here’s why: $4,750 x 0.02 = $95. That’s the point where you break even. Anything above that and you’re ahead.
NerdWallet explains that annual fee cards are worth it when the card’s benefits and rewards exceed the cost of carrying it.
The “Subsequent Years Net” result in this tool already subtracts the annual fee for you. If that number is positive, the card is earning more than it costs.
When Annual Fee Cards Shine
Annual fee cards tend to make sense when:
- Your spending heavily matches the card’s bonus categories
- The card offers perks like travel credits, cell phone protection, or acquisition coverage
- The sign-up bonus is large enough to cover 2 or more years of the fee upfront
When to Stick With No-Fee Cards
No-fee cards win when:
- Your total annual card spending is under $5,000
- Your spending doesn’t match any specific bonus category
- You want simplicity with no maintenance required
How Sign-Up Bonuses Change Your Year 1 Earnings
A sign-up bonus (also called a welcome offer) is a one-time cash reward for meeting a spending threshold in your first few months of card ownership.
For example: “Earn $200 cash back after spending $500 in the first 3 months.”
How It Factors In
This tool adds the sign-up bonus directly to your Year 1 Net Cash Back. That’s why Year 1 often looks much higher than next years.
Here’s an example:
- Annual Cash Back from spending: $340
- Annual Fee: $95
- Sign-Up Bonus: $200
- Year 1 Net: $445
- Year 2+ Net: $245
That $200 bonus effectively offsets the annual fee for more than two years. That’s a solid deal, as long as the ongoing value holds up.
A Word of Caution
Don’t let a large sign-up bonus cloud your judgment. Always look at the long-term annual value. A $300 bonus on a card that barely earns $80/year in cash back (before fees) may not make sense after Year 1.
Category Spending Caps: What They Are and Why They Matter
A spending cap is a limit on how much you can earn at a card’s bonus rate within a specific category.
For example, a card might offer 6% cash back on groceries, but only up to $6,000 in grocery purchases per year. Once you hit that cap, the rate drops to 1%.
How the Cap Formula Works
The cash back tool manages this process through this logic.
- Any spending up to the cap earns the category rate
- Any spending above the cap earns the base rate
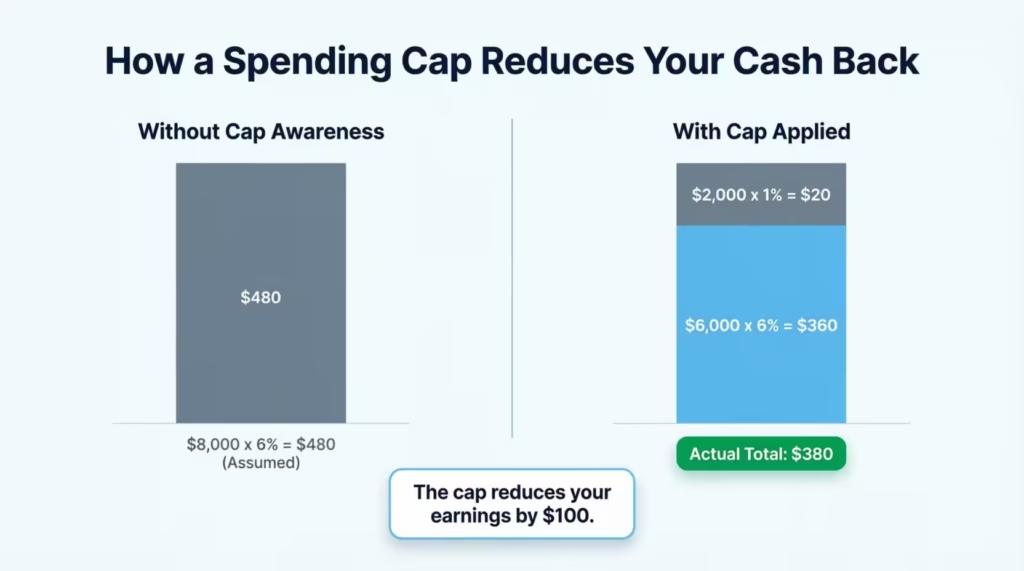
Let’s say you spend $8,000 a year on groceries and your card has a $6,000 cap at 6% (then 1% above):
- First $6,000 x 6% = $360
- Remaining $2,000 x 1% = $20
- Total grocery cash back = $380
Without knowing about the cap, you might have expected $480 (8,000 x 6%). The real number is $100 less. That gap matters when you’re comparing cards.
What to Enter if Your Card Has No Cap
Just leave the “Category Cap” field blank. The calculator treats no entry as no limit, so 100% of your spending earns the bonus rate.
Flat Rate vs. Category-Based Rewards: Which Is Right for You?
This is one of the most practical questions you can answer with this tool. Let’s break it down.
Flat Rate Cards: Pros and Cons
Pros:
- No categories to track
- Simple and predictable
- Good for varied or unpredictable spending
Cons:
- Lower ceiling on total earnings
- Can’t take advantage of high-spend categories
Category-Based Cards: Pros and Cons
Pros:
- Higher rates on your biggest spending areas
- Can earn significantly more if your spending fits the categories
- Better suited to households with consistent, predictable spending patterns
Cons:
- More complexity to manage
- Can underperform flat-rate cards if your spending doesn’t align
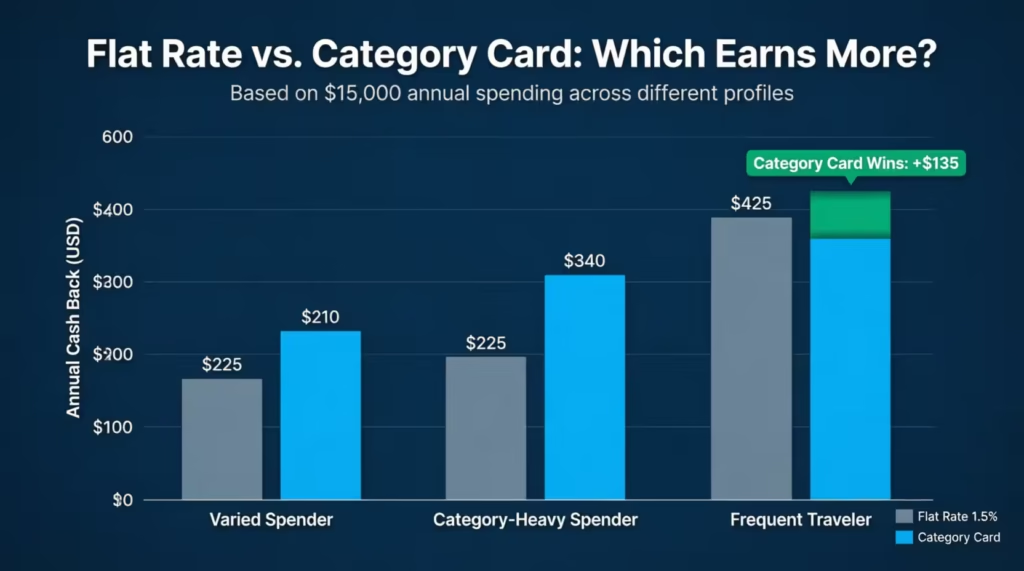
A Quick Rule of Thumb
If your top two or three categories make up 60% or more of your total spending, a category card will almost always win. If your spending is spread thin across 8 or more categories, a flat-rate card is likely a better fit.
Run both scenarios in the calculator and let the numbers tell you which card fits your life.
Expert Tips to Maximize Your Cash Back Rewards
Personal tip from experience: Treating cash back optimization like a simple budgeting exercise produces better results than chasing high rates on cards you rarely use. Here are the strategies that consistently achieve results.
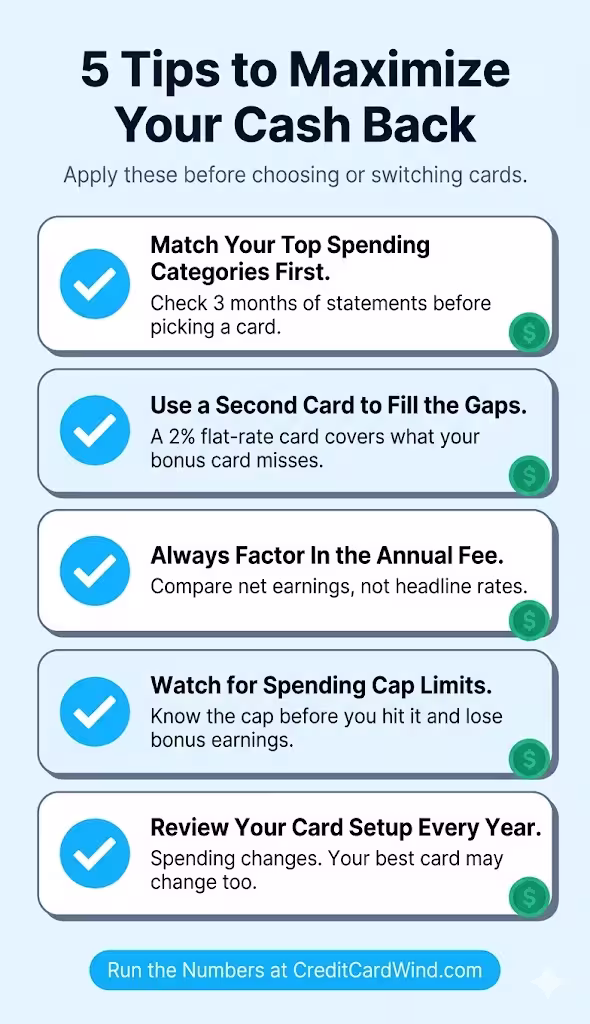
Tip 1: Match Your Top Spending Categories First
Before picking a card, look at your last 3 months of bank or credit card statements. Find your top two spending categories. Then choose a card with the best rate in those areas.
Jennifer, a nurse in Chicago, realized she was spending $650 a month on groceries for her family of four. Switching to a card with 5% grocery rewards instead of her old 1.5% flat-rate card added $270 in annual cash back.
Tip 2: Use a Second Card to Plug the Gaps
Most high-earning category cards have a low base rate (often 1%) on spending outside those categories. A second no-fee flat-rate card with a 2% rate can effectively address those gaps.
This “two-card strategy” is popular among experienced cardholders and doesn’t require carrying a balance.
Tip 3: Always Factor In the Annual Fee
A card that earns $400/year but costs $95 in fees nets you $305. A no-fee card earning $250 nets you $250. The premium card wins here, but only by $55. Is that difference worth managing an extra card? That’s a personal call.
Tip 4: Don’t Let a Bonus Category Cap Sneak Up on You
If your grocery spending is $700/month (or $8,400/year) and your card caps rewards at $6,000, you’re losing real money past that point. Use the category cap field in this tool to see the actual impact.
Tip 5: Run the Numbers Every Year
Spending patterns change. A card that was perfect when you were single may not be the best fit after buying a house or having kids. Revisit your rewards setup once a year. It takes about 10 minutes and can easily be worth $100 or more.
Common Mistakes That Cost Cardholders Money
Even experienced cardholders make these errors. Avoiding them can add up to real savings.
Mistake 1: Comparing Cards Only on Their Headline Rate
A “5% groceries” card sounds amazing. But if it has a $150 annual fee and your grocery spend is only $3,000 a year, you’d earn $150 in grocery rewards. That covers the fee by a small margin. No real gain.
Always compare net value, not gross rates.
Mistake 2: Ignoring the Base Rate
Most spending doesn’t fall into bonus categories. If your card earns 5% on groceries but only 0.5% on everything else, that low base rate can drag down your total earnings significantly.
Mistake 3: Forgetting to Activate Rotating Bonuses
Some cards require you to manually activate quarterly bonus categories. If you forget, you earn the base rate instead. That’s a common and costly mistake.
Mistake 4: Overestimating Sign-Up Bonuses
A $300 sign-up bonus is nice. But if you have to spend $3,000 in 3 months to earn it, make sure that spending is money you were going to spend anyway. Spending extra to hit a bonus erases the benefit.
Mistake 5: Carrying a Balance
Cash back cards usually have interest rates of 20% or higher. If you carry a balance, the interest charges will wipe out any rewards you earn. Cash back rewards only make financial sense when you pay your balance in full each month.
Frequently Asked Questions (FAQs)
How is cash back calculated on a credit card?
Cash back is calculated by multiplying your purchase amount by the card’s reward rate. For example, spending $200 on groceries with a 3% grocery rate earns $6 in cash back.
What is a good effective cash back rate?
An effective cash back rate above 1.5% is generally considered solid for everyday spending. Rates above 2% are excellent and usually require a card with category bonuses.
Does a higher cash back rate always mean a better card?
Not always. A card with a 5% rate and a $150 annual fee may net you less than a no-fee card earning 2%, depending on your spending volume. Always compare net earnings after fees.
What happens to my cash back when I hit a spending cap?
Once you exceed a category cap, extra spending in that category earns your card’s base rate instead of the bonus rate. For example, spending above a $6,000 grocery cap might drop from 5% to 1%.
Is it worth getting a credit card with an annual fee for cash back?
It can be worth it if the rewards and perks outweigh the fee. A $95 annual fee card needs to earn at least $95 more than a no-fee alternative to make financial sense. NerdWallet suggests running the numbers before committing.
How does a sign-up bonus affect my cash back earnings?
A sign-up bonus boosts your Year 1 net earnings significantly but doesn’t repeat in future years. It’s important to check a card’s long-term annual value separately from the one-time welcome offer.
Can I use multiple cash back cards to earn more rewards?
Yes. Many cardholders use a category-based card for high-reward spending areas and a flat-rate card for everything else. This “two-card strategy” can maximize total cash back without carrying many cards.
What is the difference between cash back and reward points?
Cash back gives you a straightforward dollar-for-dollar return. Reward points have variable values depending on how you redeem them and can be worth more or less than their face value. Cash back is simpler and more predictable.
Does carrying a balance reduce my cash back earnings?
Your cash back still accrues, but interest charges on a carried balance will typically exceed the value of any rewards earned. Cash back cards are most beneficial when the balance is paid in full each month.
How often should I compare my credit card rewards?
Reviewing your card setup once a year is a good habit. Life changes, like a new home, new job, or growing family, can shift your spending patterns significantly, making a different card more beneficial.
Bottom Line
We’ve covered a lot of ground here. From understanding the three types of cash back structures to breaking down the exact formulas this tool uses, and from knowing when an annual fee makes sense to spotting the category caps that can quietly reduce your earnings.
If I had to pick one takeaway, it’s this: run the numbers before you decide. Gut feelings about which card “seems better” often don’t match the math. The credit card cash back calculator on this page does the hard work for you in seconds.
I find the Effective Cash Back Rate to be the most useful output for my needs. It strips away the noise and tells you the true return on your spending.
If this guide helped you, share it with a friend or family member who’s still guessing at their rewards. Share it on social media and help them stop leaving money on the table.